
Mapping of cyclist casualty data by police area
| The number of cyclists reported as killed or seriously injured in Great Britain has been increasing since 2004 (more information here). This page give information on the geographical pattern of the increase. Reported cyclist casualties as shown for each police area as a rate per 100,000 population for each year since 2005. | 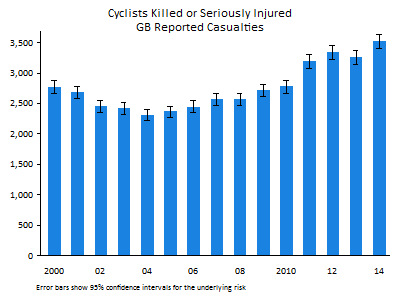 |
Maps for all calendar years 2005 to 2011
Small-sized maps are shown here to give an overview. For full-size maps, see the section below.2005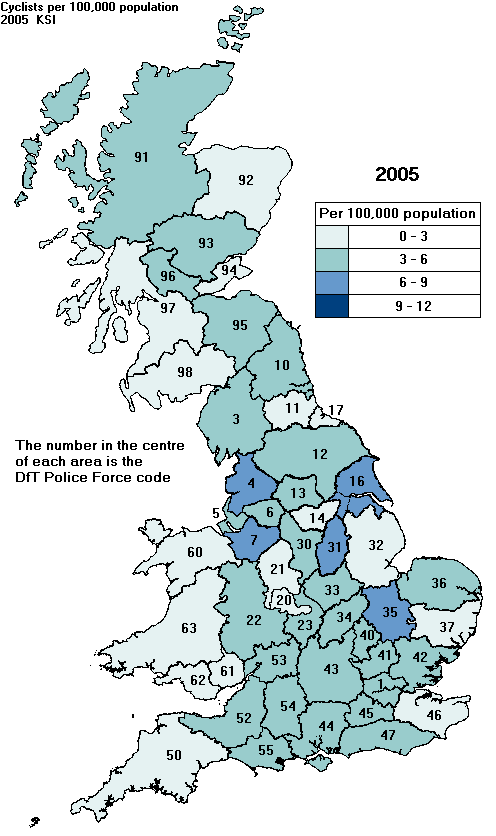 | 2006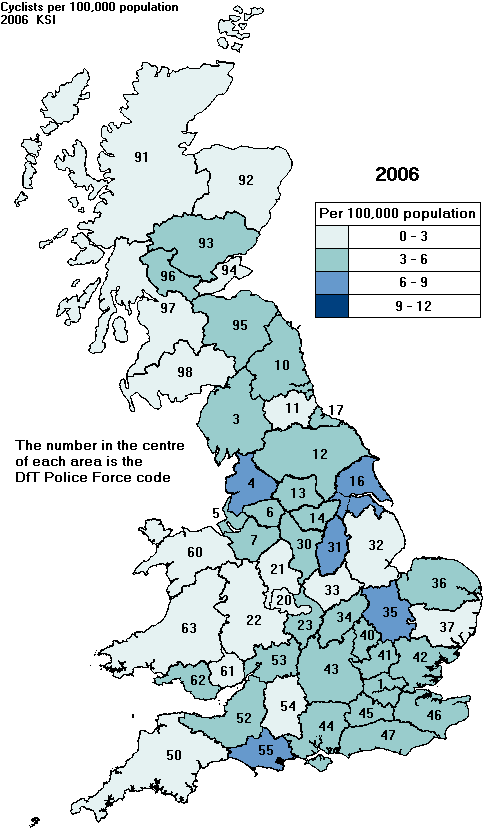 | 2007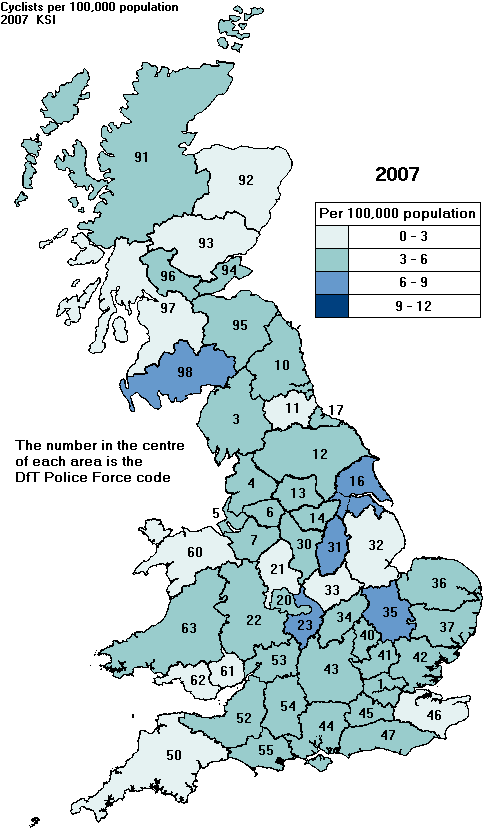 | 2008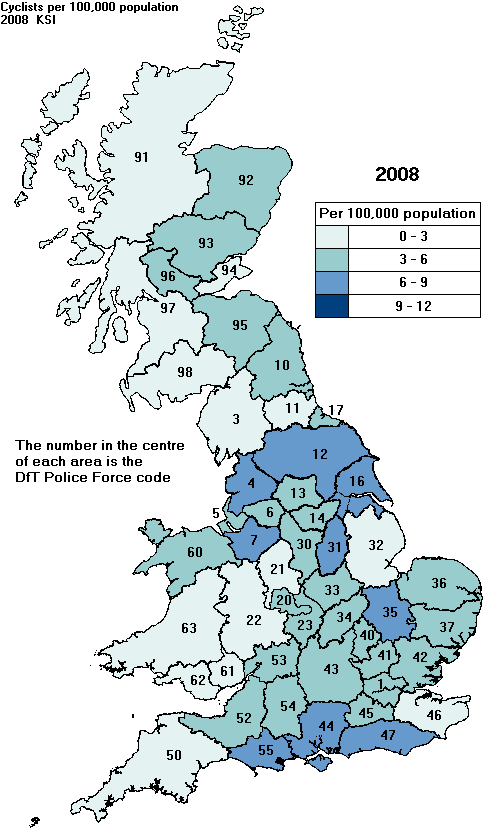 |
2009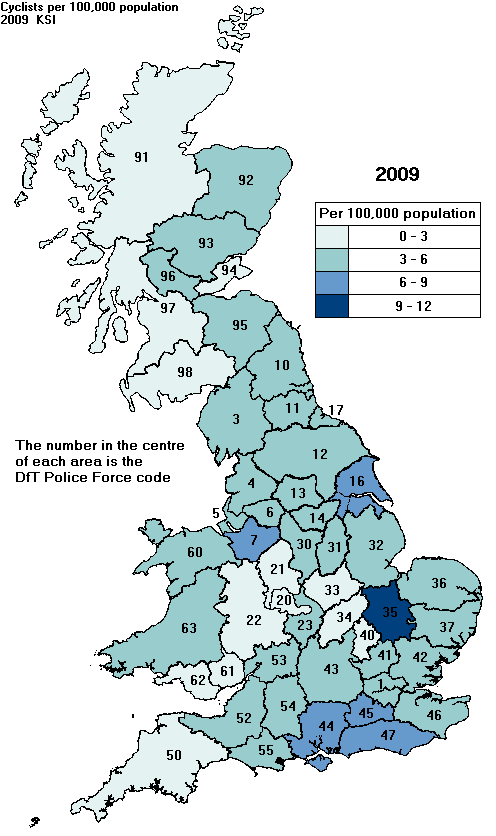 | 2010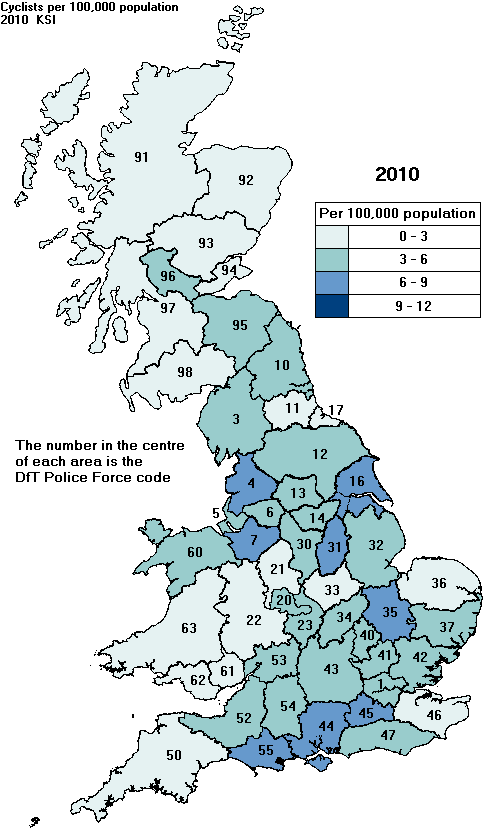 | 2011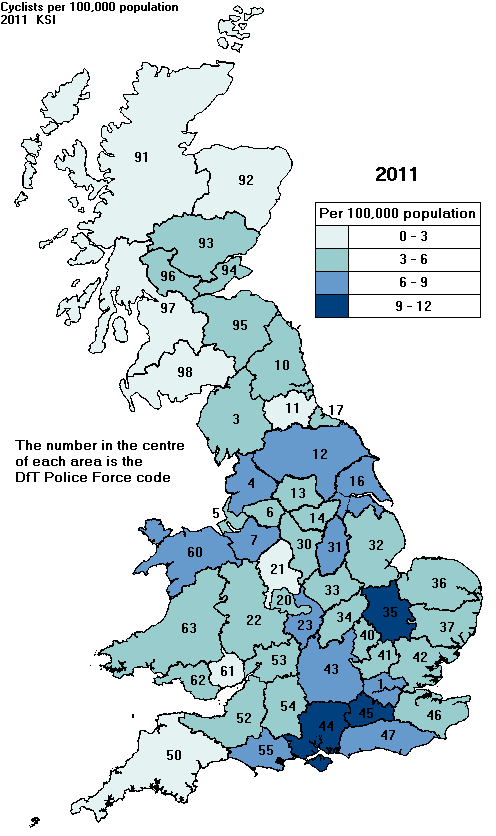 | Key 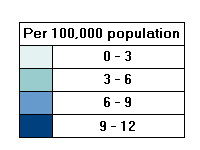 |
Maps for each calendar year 2005 to 2011
| The maps show numbers of cyclists reported as killed or seriously injured as rates per 100,000 population for the 50 police force areas of Great Britain. (The City of London and Metropolitan Police areas have been combined.) Key to areas
|
Comment
Three areas have increased by two colour categories between 2005 and 2011.
These are
• Hampshire
• Surrey
• North Wales
Sources
- The KSI data was obtained from the DfT road casualty databases (http://data.gov.uk/dataset/road-accidents-safety-data/).
- Population data was taken from "Mid-2010 Population Estimates: Selected age groups for local authorities in the United Kingdom; estimated resident population." See here.