
Road Casualties Great Britain
The latest Department for Transport reported road casualty figures (for 2018) were released in September 2019 (covering England, Scotland and Wales).
This report gives some detailed analyses of the following data.
- Children killed or seriously injured
- Numbers killed or seriously injured (all ages)
- Numbers killed (all ages)
- Notes and sources
Children killed or seriously injured
| The pie chart shows the breakdown by mode of travel for children reported as killed or seriously injured (KSI) during 2018. 'Children' are defined as 0 - 15 years. | 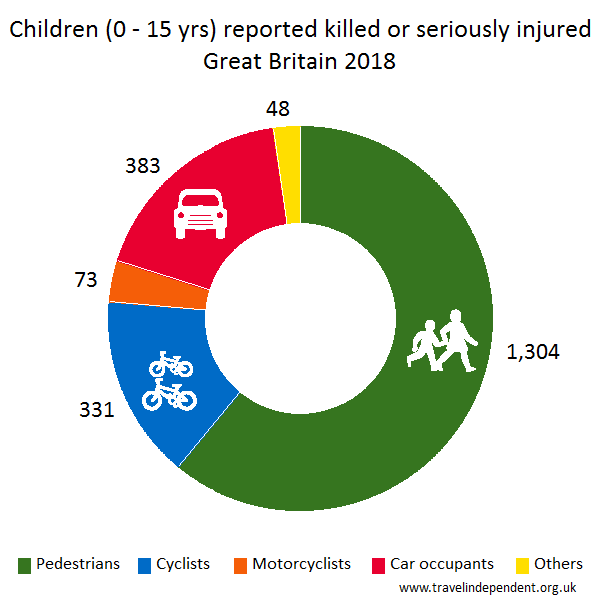 |
The table gives the figures for each year for children reported killed or seriously injured:
| Pedestrians | Cyclists | Car occupants | Others | Total | |
|---|---|---|---|---|---|
| 2005 | 2,134 (61%) | 527 (15%) | 595 (17%) | 216 (6%) | 3,472 (100%) |
| 2006 | 2,025 (61%) | 503 (15%) | 596 (18%) | 170 (5%) | 3,294 (100%) |
| 2007 | 1,899 (61%) | 522 (17%) | 526 (17%) | 143 (5%) | 3,090 (100%) |
| 2008 | 1,784 (64%) | 417 (15%) | 490 (17%) | 116 (4%) | 2,807 (100%) |
| 2009 | 1,660 (62%) | 458 (17%) | 463 (17%) | 90 (3%) | 2,671 (100%) |
| 2010 | 1,646 (66%) | 398 (16%) | 360 (14%) | 98 (4%) | 2,502 (100%) |
| 2011 | 1,602 (66%) | 398 (17%) | 336 (14%) | 76 (3%) | 2,412 (100%) |
| 2012 | 1,545 (68%) | 324 (14%) | 346 (15%) | 57 (3%) | 2,272 (100%) |
| 2013 | 1,358 (69%) | 282 (14%) | 286 (14%) | 54 (3%) | 1,980 (100%) |
| 2014 | 1,379 (66%) | 279 (13%) | 337 (16%) | 87 (4%) | 2,082 (100%) |
| 2015 | 1,283 (65%) | 278 (14%) | 334 (17%) | 69 (4%) | 1,964 (100%) |
| 2016 | 1,287 (61%) | 317 (15%) | 401 (19%) | 97 (5%) | 2,102 (100%) |
| 2017 | 1,269 (59%) | 369 (17%) | 390 (18%) | 118 (5%) | 2,146 (100%) |
| 2018 | 1,304 (61%) | 331 (15%) | 383 (18%) | 121 (6%) | 2,139 (100%) |
The totals of reported child pedestrian and child cylist KSI casualties have fallen, but so too have the mileages walked and cycled (with an increase in obesity), and so it is not clear that roads have become any safer for children.
Numbers killed or seriously injured (all ages)
The charts give the numbers of reported casualties for each mode of travel by year (except for the bottom right chart, which gives the percentages of the total). The 'error bars' show the 95% confidence intervals - read more on confidence intervals here including why they are needed when interpreting charts.
| Pedestrians | Cyclists |
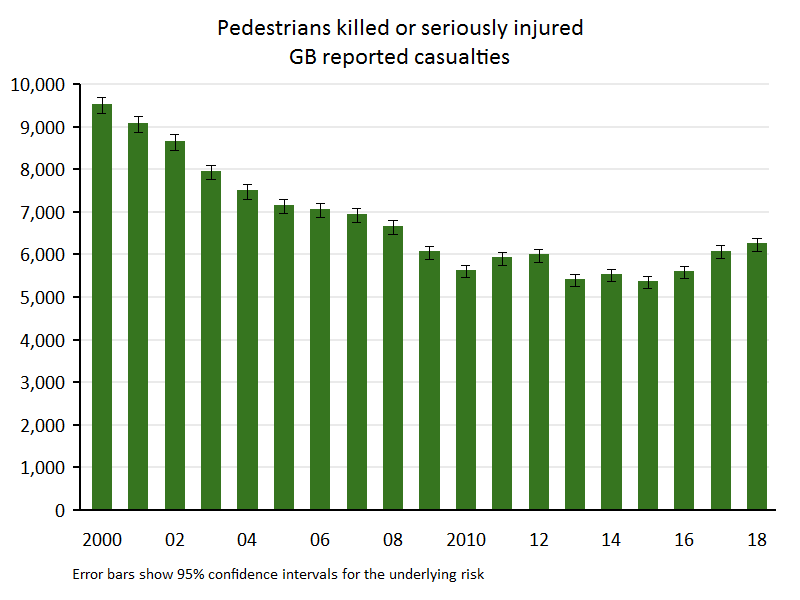 | 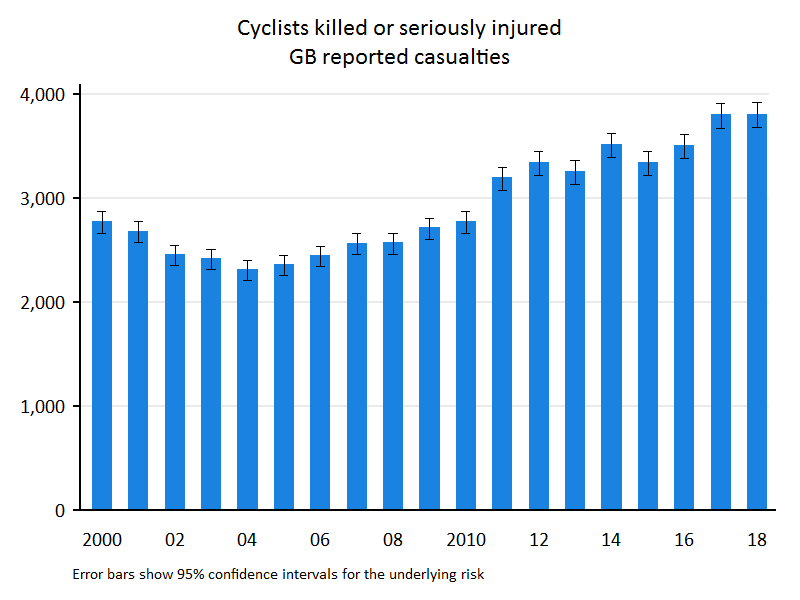 |
| Motorcyclists | Car occupants |
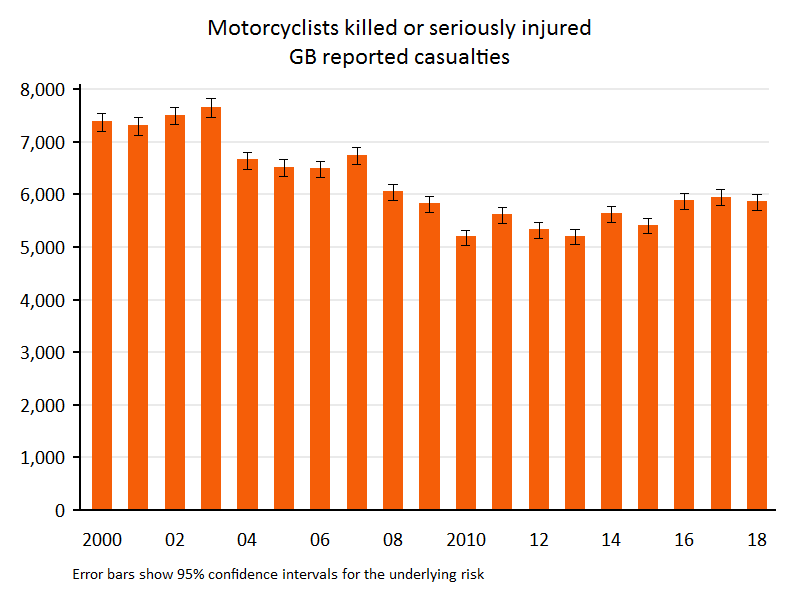 | 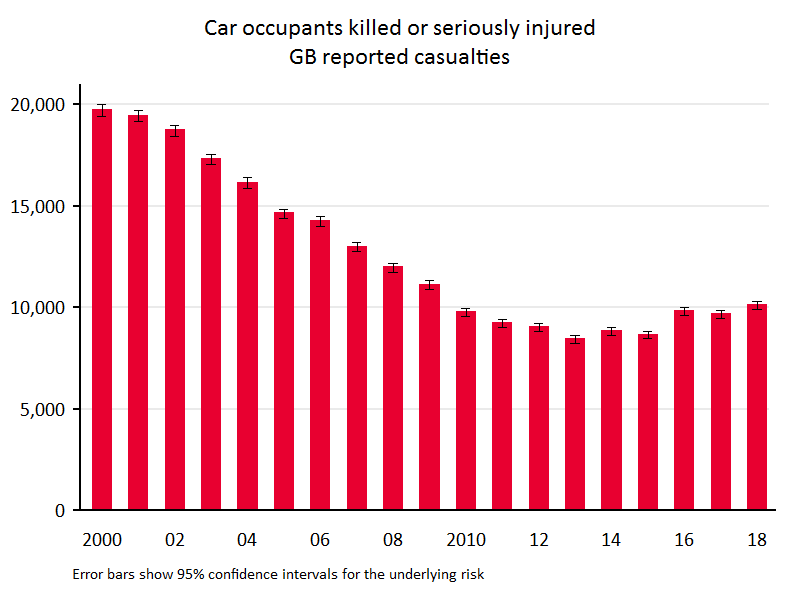 |
| All modes (numbers) | All modes (percentages) |
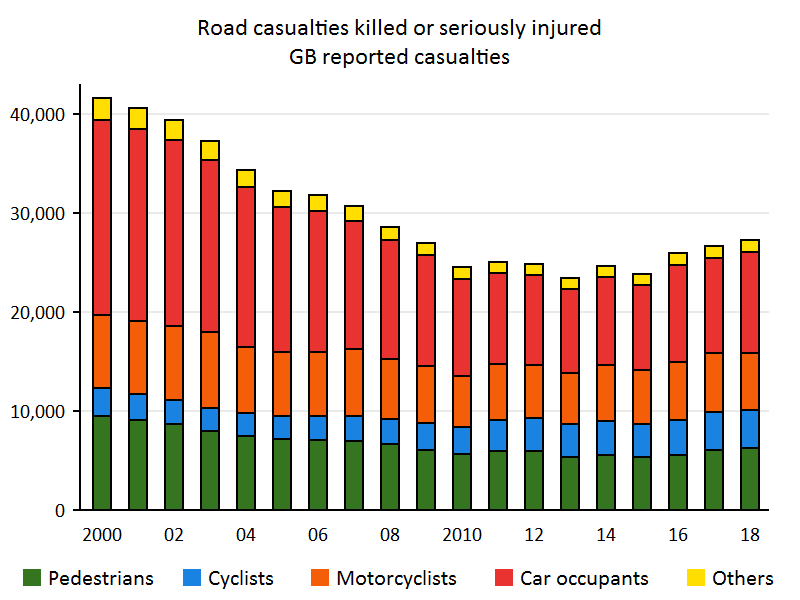 | 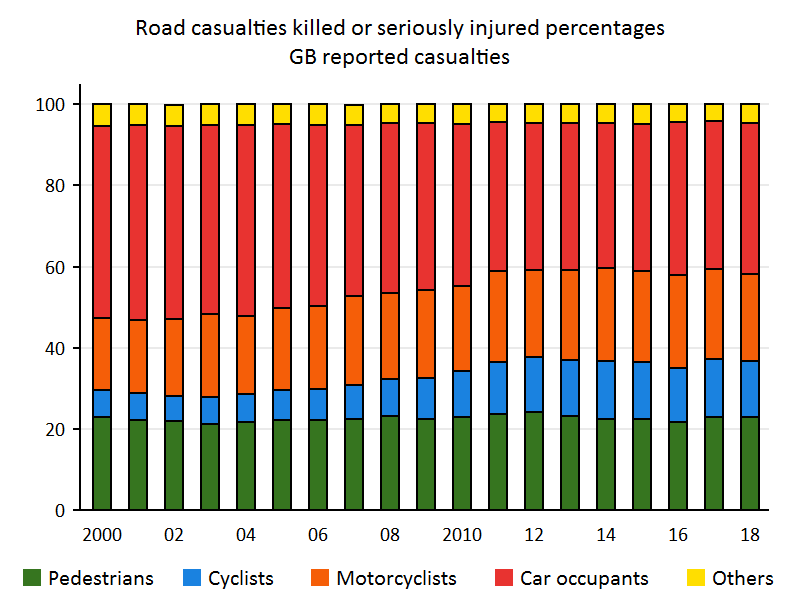 |
The figures for casualties reported killed or seriously injured are:
| Pedestrians | Cyclists | Motorcyclists | Car occupants | Others | Total | |
|---|---|---|---|---|---|---|
| 2001 | 9,064 (22.3%) | 2,678 (6.6%) | 7,305 (18.0%) | 19,424 (47.9%) | 2,089 (5.2%) | 40,560 (100%) |
| 2002 | 8,631 (21.9%) | 2,450 (6.2%) | 7,500 (19.0%) | 18,728 (47.5%) | 2,098 (5.3%) | 39,407 (100%) |
| 2003 | 7,933 (21.3%) | 2,411 (6.5%) | 7,652 (20.6%) | 17,291 (46.5%) | 1,928 (5.2%) | 37,215 (100%) |
| 2004 | 7,478 (21.8%) | 2,308 (6.7%) | 6,648 (19.4%) | 16,144 (47.0%) | 1,773 (5.2%) | 34,351 (100%) |
| 2005 | 7,129 (22.2%) | 2,360 (7.3%) | 6,508 (20.2%) | 14,617 (45.5%) | 1,541 (4.8%) | 32,155 (100%) |
| 2006 | 7,051 (22.1%) | 2,442 (7.7%) | 6,484 (20.4%) | 14,254 (44.8%) | 1,614 (5.1%) | 31,845 (100%) |
| 2007 | 6,924 (22.5%) | 2,564 (8.3%) | 6,737 (21.9%) | 12,967 (42.2%) | 1,528 (5.0%) | 30,720 (100%) |
| 2008 | 6,642 (23.2%) | 2,565 (9.0%) | 6,049 (21.2%) | 11,968 (41.9%) | 1,348 (4.7%) | 28,572 (100%) |
| 2009 | 6,045 (22.5%) | 2,710 (10.1%) | 5,822 (21.6%) | 11,112 (41.3%) | 1,223 (4.5%) | 26,912 (100%) |
| 2010 | 5,605 (22.9%) | 2,771 (11.3%) | 5,183 (21.1%) | 9,749 (39.8%) | 1,202 (4.9%) | 24,510 (100%) |
| 2011 | 5,907 (23.6%) | 3,192 (12.8%) | 5,609 (22.4%) | 9,225 (36.9%) | 1,090 (4.4%) | 25,023 (100%) |
| 2012 | 5,979 (24.1%) | 3,340 (13.5%) | 5,322 (21.5%) | 9,033 (36.4%) | 1,119 (4.5%) | 24,793 (100%) |
| 2013 | 5,396 (23.1%) | 3,252 (13.9%) | 5,197 (22.2%) | 8,426 (36.1%) | 1,099 (4.7%) | 23,370 (100%) |
| 2014 | 5,509 (22.4%) | 3,514 (14.3%) | 5,628 (22.9%) | 8,832 (35.9%) | 1,099 (4.5%) | 24,582 (100%) |
| 2015 | 5,349 (22.4%) | 3,337 (14.0%) | 5,402 (22.6%) | 8,643 (36.2%) | 1,138 (4.8%) | 23,869 (100%) |
| 2016 | 5,588 (21.6%) | 3,499 (13.5%) | 5,872 (22.7%) | 9,791 (37.8%) | 1,143 (4.4%) | 25,893 (100%) |
| 2017 | 6,064 (22.8%) | 3,799 (14.3%) | 5,941 (22.3%) | 9,681 (36.4%) | 1,139 (4.3%) | 26,624 (100%) |
| 2018 | 6,238 (22.9%) | 3,806 (13.9%) | 5,851 (21.4%) | 10,115 (37.1%) | 1,285 (4.7%) | 27,295 (100%) |
Numbers killed (all ages)
The figures for reported fatalities are:
| Pedestrians | Cyclists | Motorcyclists | Car occupants | Others | Total | |
|---|---|---|---|---|---|---|
| 2005 | 671 (21.0%) | 148 (4.6%) | 569 (17.8%) | 1675 (52.3%) | 138 (4.3%) | 3201 (100%) |
| 2006 | 675 (21.3%) | 146 (4.6%) | 599 (18.9%) | 1612 (50.8%) | 140 (4.4%) | 3172 (100%) |
| 2007 | 646 (21.9%) | 136 (4.6%) | 588 (20.0%) | 1432 (48.6%) | 144 (4.9%) | 2946 (100%) |
| 2008 | 572 (22.5%) | 115 (4.5%) | 493 (19.4%) | 1257 (49.5%) | 101 (4.0%) | 2538 (100%) |
| 2009 | 500 (22.5%) | 104 (4.7%) | 472 (21.2%) | 1059 (47.7%) | 87 (3.9%) | 2222 (100%) |
| 2010 | 405 (21.9%) | 111 (6.0%) | 403 (21.8%) | 835 (45.1%) | 96 (5.2%) | 1850 (100%) |
| 2011 | 453 (23.8%) | 107 (5.6%) | 362 (19.0%) | 883 (46.4%) | 96 (5.0%) | 1901 (100%) |
| 2012 | 420 (23.9%) | 118 (6.7%) | 328 (18.7%) | 801 (45.7%) | 87 (5.0%) | 1754 (100%) |
| 2013 | 398 (23.2%) | 109 (6.4%) | 331 (19.3%) | 785 (45.8%) | 90 (5.3%) | 1,713 (100%) |
| 2014 | 446 (25.1%) | 113 (6.4%) | 339 (19.1%) | 797 (44.9%) | 80 (4.5%) | 1,775 (100%) |
| 2015 | 409 (23.6%) | 100 (5.8%) | 365 (21.1%) | 755 (43.6%) | 103 (5.9%) | 1,732 (100%) |
| 2016 | 448 (25.0%) | 102 (5.7%) | 319 (17.8%) | 816 (45.5%) | 107 (6.0%) | 1,792 (100%) |
| 2017 | 470 (26.2%) | 101 (5.6%) | 349 (19.5%) | 787 (43.9%) | 86 (4.8%) | 1,793 (100%) |
| 2018 | 456 (25.6%) | 99 (5.5%) | 354 (19.8%) | 777 (43.6%) | 98 (5.5%) | 1,784 (100%) |
| The bar chart plots DfT figures for risks per km taken from the DfT annual report [1]. | 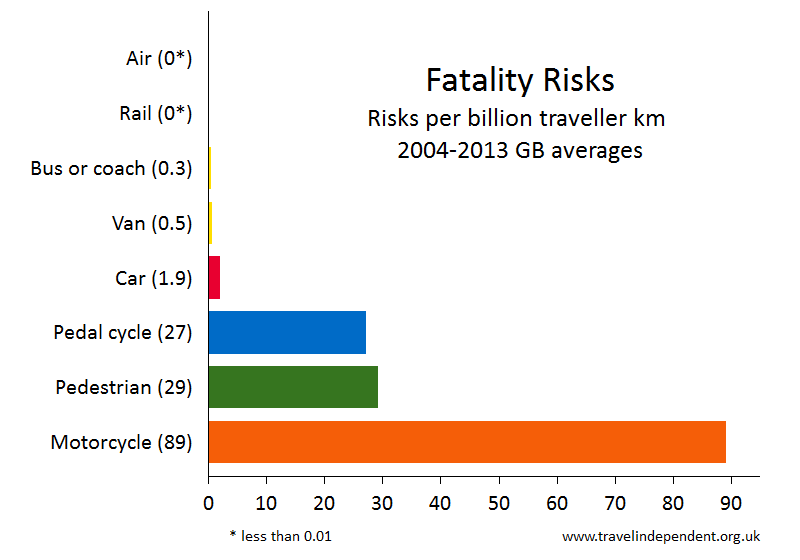 |
Sources
The data summarised here is the STATS19 data collected by police forces and published annually by the DfT. The figures are taken from DfT reports and/or from analysis of the DfT database - se the links page.
Almost all road deaths are reported, but some serious injuries are not reported and only a minority of slight injuries are reported - see the discussions in the annual DfT reports. Injuries to pedestrians are not included unless a vehicle is involved - so, for example, falls on icy pavements are excluded.
| [1] | Passenger casualty rates for different modes of travel (RAS53) https://www.gov.uk/government/statistical-data-sets/ras53-modal-comparisons or from here. |
Breakdown by highway authorities and police areas
View charts and tables for individual local authorities or for individual police areas.