
Mapping of pedestrian casualty data by police area
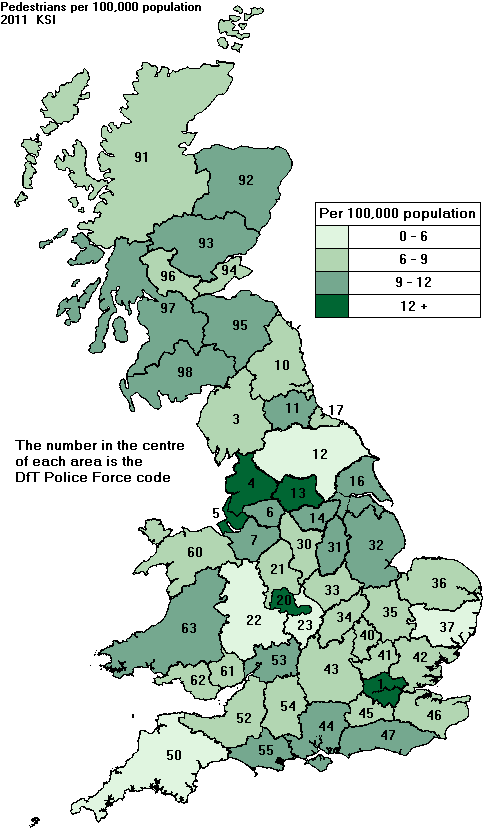 | The map shows pedestrians reported as killed or seriously injured as rates per 100,000 population for the 50 police force areas of Great Britain in 2011. (The City of London and Metropolitan Police areas have been combined). The highest rate was 2.9 times the lowest rate. Areas with the lowest rates were • Warwickshire • Suffolk • Devon and Cornwall • North Yorkshire • West Mercia Areas with the highest rates were • Merseyside • West Midlands • Lancashire • West Yorkshire • Metropolitan Police The reasons for the large variation are not clear. Some variation with geography might be expected, but some areas with similar geography have very different rates. It appears that no monitoring of rates by police area is carried out by the Department for Transport, the Association of Chief Police Officers, or Her Majesty's Inspectorate of Constabulary. A .pdf summary file can be downloaded from here. The table below gives the full figures. The sources used are given below the table. |
| Rank | Police Force Name (DfT Police Code) | Pedestrian KSI per 100,000 Population | Pedestrians KSI Casualties | Population (thousands) |
|---|---|---|---|---|
| 1 | Warwickshire (23) | 4.85 | 26 | 536 |
| 2 | Suffolk (37) | 5.00 | 36 | 720 |
| 3 | Devon and Cornwall (50) | 5.71 | 96 | 1,680 |
| 4 | North Yorkshire (12) | 5.86 | 47 | 802 |
| 5 | West Mercia (22) | 5.87 | 70 | 1,193 |
| 6 | Staffordshire (21) | 6.16 | 66 | 1,071 |
| 7 | Avon and Somerset (52) | 6.22 | 101 | 1,623 |
| 8 | Hertfordshire (41) | 6.50 | 72 | 1,108 |
| 9 | Kent (46) | 6.71 | 113 | 1,684 |
| 10 | Norfolk (36) | 6.73 | 58 | 862 |
| 11 | Gwent (61) | 6.77 | 38 | 561 |
| 12 | Fife (94) | 6.85 | 25 | 365 |
| 13 | Thames Valley (43) | 7.06 | 159 | 2,253 |
| 14 | Northern (91) | 7.23 | 21 | 290 |
| 15 | Cleveland (17) | 7.28 | 41 | 564 |
| 16 | Bedfordshire (40) | 7.48 | 46 | 615 |
| 17 | Central (96) | 7.49 | 22 | 294 |
| 18 | Leicestershire (33) | 7.65 | 76 | 994 |
| 19 | Cumbria (3) | 7.69 | 38 | 494 |
| 20 | Wiltshire (54) | 7.71 | 51 | 662 |
| 21 | Derbyshire (30) | 7.92 | 80 | 1,011 |
| 22 | Cambridgeshire (35) | 8.10 | 64 | 790 |
| 23 | Surrey (45) | 8.43 | 95 | 1,127 |
| 24 | Northamptonshire (34) | 8.44 | 58 | 687 |
| 25 | Essex (42) | 8.46 | 147 | 1,738 |
| 26 | South Wales (62) | 8.49 | 107 | 1,261 |
| 27 | Northumbria (10) | 8.94 | 128 | 1,432 |
| 28 | North Wales (60) | 8.99 | 61 | 679 |
| 29 | Durham (11) | 9.16 | 56 | 612 |
| 30 | Gloucestershire (53) | 9.27 | 55 | 594 |
| 31 | Lincolnshire (32) | 9.39 | 66 | 703 |
| 32 | Dumfries and Galloway (98) | 9.45 | 14 | 148 |
| 33 | Humberside (16) | 9.55 | 88 | 921 |
| 34 | Cheshire (7) | 10.01 | 101 | 1,009 |
| 35 | Dorset (55) | 10.07 | 72 | 715 |
| 36 | Greater Manchester (6) | 10.42 | 274 | 2,629 |
| 37 | Dyfed-Powys (63) | 10.87 | 55 | 506 |
| 38 | Lothian and Borders (95) | 11.06 | 105 | 950 |
| 39 | South Yorkshire (14) | 11.37 | 151 | 1,328 |
| 40 | Strathclyde (97) | 11.48 | 255 | 2,222 |
| 41 | Hampshire (44) | 11.52 | 217 | 1,884 |
| 42 | Nottinghamshire (31) | 11.60 | 126 | 1,087 |
| 43 | Tayside (93) | 11.67 | 47 | 403 |
| 44 | Sussex (47) | 11.75 | 185 | 1,574 |
| 45 | Grampian (92) | 11.99 | 66 | 551 |
| 46 | Metropolitan Police (1) | 12.52 | 980 | 7,825 |
| 47 | West Yorkshire (13) | 12.94 | 291 | 2,250 |
| 48 | Lancashire (4) | 13.80 | 200 | 1,449 |
| 49 | West Midlands (20) | 13.97 | 371 | 2,655 |
| 50 | Merseyside (5) | 14.04 | 190 | 1,353 |
| All 50 areas | 9.77 | 5,907 | 60,462 |
Sources
• The KSI data was obtained from the DfT road casualty databases (http://data.gov.uk/dataset/road-accidents-safety-data/).
• Population data was taken from "Mid-2010 Population Estimates: Selected age groups for local authorities in the United Kingdom; estimated resident population." See here.